

Historic Race HR by Duration
What would be typical HR values for an X-hour race?
Background:
I get a lot of questions about race pacing. Pacing depends on many factors (race duration, terrain, fitness, experience, temperature, fueling, hydration, etc.). Still, athletes often want a reasonable starting point—especially when they don’t have power data. This page summarizes historic race files to provide general guidance using heart rate (HR).
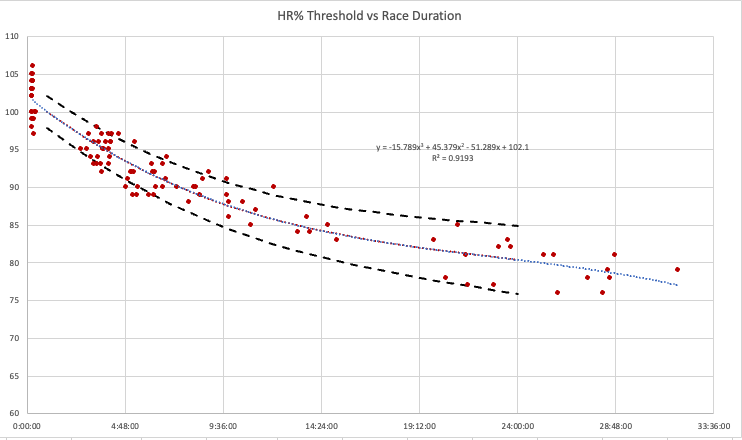
What the chart shows:
The chart summarizes “average race HR” expressed as a percentage of threshold HR versus race duration.
Percent of threshold HR = (Average race HR) / (Threshold HR)
Example: if an athlete averaged 156 bpm for a 3:33:48 race and their threshold HR is 163 bpm, then 156 / 163 = 95.7%.
Important: this is the average HR over the entire race (not max HR). HR often starts higher early (competition arousal/nerves) and can change over time with heat, hydration, and fatigue.[4]
What data is included:
This dataset includes races from 12 athletes, spanning short time trials through very long endurance events (including events longer than 24 hours). The goal was to represent “maximal effort” races. I manually removed files where an athlete was clearly limited by something other than pacing and fitness (major issues, group drafting, etc.).
In general, less experienced and/or less well-trained athletes often sustain a slightly lower percent of threshold at the same duration. That can reflect pacing confidence, durability/muscular fatigue, fueling, heat management, or simply less experience “riding the line” for long durations.
How to use the calculator:
Below is a calculator/table based on the historic dataset curve:
Enter your threshold HR.
Find your expected race duration.
Use the “Average” as a starting point, and the Low/High range as typical athlete-to-athlete variance.
If you are new to racing, start closer to the low end of the range and adjust as you gain experience. Remember: this is average HR for the entire race—many athletes start a little higher and fade a bit later.
How to estimate threshold HR (if you don’t already know it):
A common field method is a hard 20-minute effort, and using the average HR from the last 15 minutes as an estimate. (Not perfect, but workable if you don’t have a validated threshold HR.)
| Duration | Low (bpm) | Average (bpm) | High (bpm) | Lower (%) | Average (%) | Upper (%) |
|---|
Important context: why race-day HR can differ from training
HR is strongly related to workload, but it does not behave like a perfectly stable “speedometer.” It’s normal for HR to run higher on race day at the same power/pace, especially early, due to competition arousal (sympathetic activation and elevated stress hormones).[4] HR can also rise over time during steady work (“cardiovascular drift”), particularly as core temperature rises and/or stroke volume declines.[1]
Common reasons your race HR might be higher than expected:
Competition arousal (excitement/nerves), especially at the start[4]
Heat stress (greater thermoregulatory demand and cardiovascular strain)[2]
Dehydration (reduced plasma volume → reduced stroke volume → higher HR for the same workload)[2][3]
Cardiovascular drift during prolonged work (HR rising relative to steady output)[1]
For some women, core temperature is higher in the post-ovulatory (luteal) phase, which can increase thermal strain in hot conditions (individual response varies).[5]
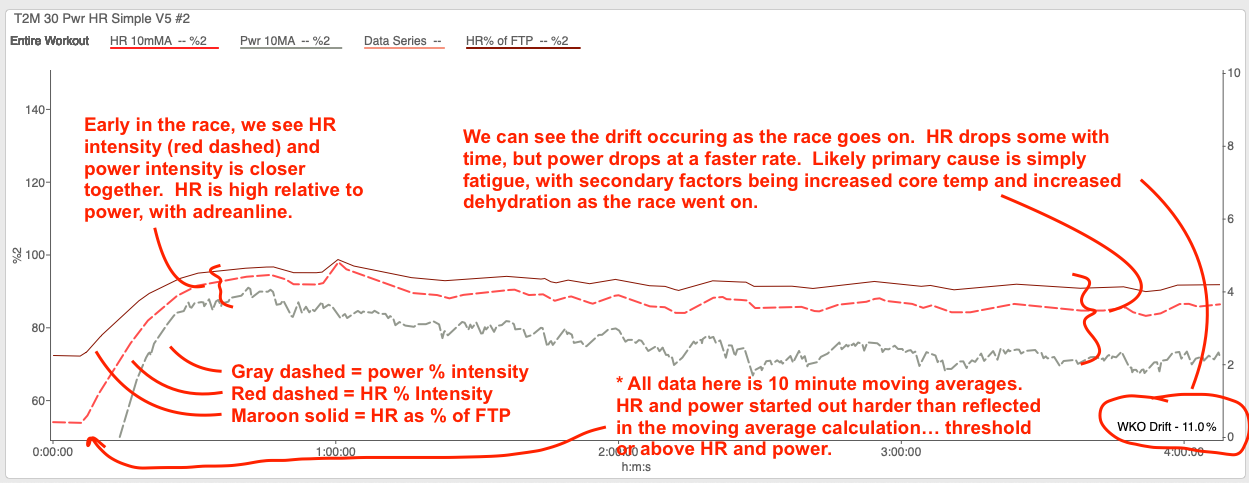
Below are a couple of examples of how output (power) and strain (heart rate) may move differently within a race. I’ve written a few notes to explain what often occurs in races:
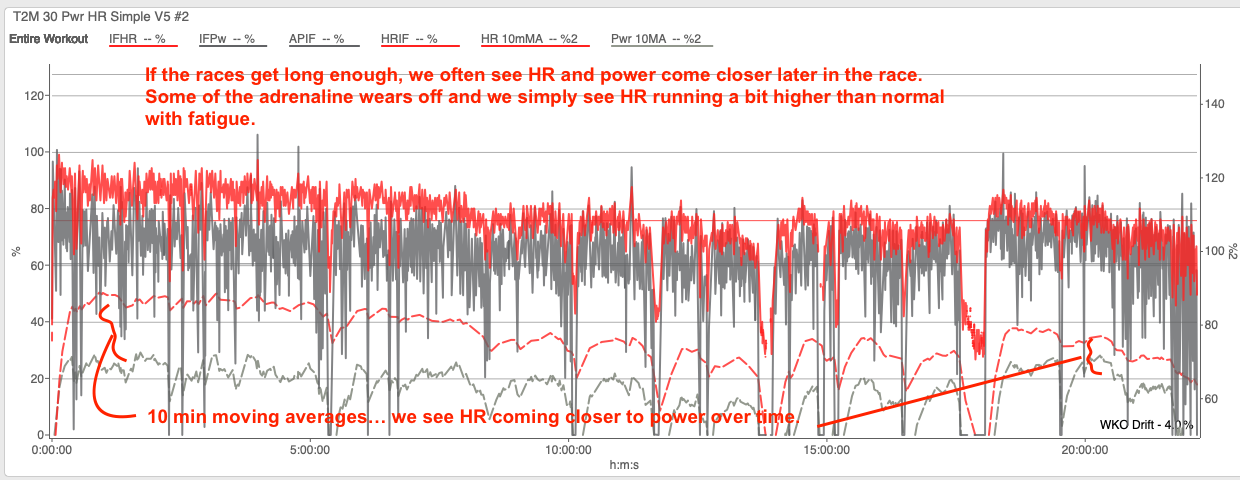
Another example, where the race goes on long enough, the adrenaline effect wears off, and HR / power start to converge closer later in the race:
Bottom line:
This tool is meant to get you in the right zip code for an average HR target by race duration. Final pacing still needs to be adjusted based on conditions and how you feel on the day.
References
[1] Coyle EF. Cardiovascular drift during prolonged exercise: new perspectives. Exercise and Sport Sciences Reviews (2001). PubMed: https://pubmed.ncbi.nlm.nih.gov/11337829/
[2] González-Alonso J, et al. The cardiovascular challenge of exercising in the heat (review). Journal of Physiology (2007). Full text (PMC): https://pmc.ncbi.nlm.nih.gov/articles/PMC2375553/
[3] Watanabe K, et al. Dehydration reduces stroke volume and cardiac output during exercise because of impaired cardiac filling and venous return. Physiological Reports (2020). Full text (PMC): https://pmc.ncbi.nlm.nih.gov/articles/PMC7294577/
[4] van Paridon KN, et al. The anticipatory stress response to sport competition: a systematic review with meta-analysis of cortisol reactivity. BMJ Open Sport & Exercise Medicine (2017). Full text (PMC): https://pmc.ncbi.nlm.nih.gov/articles/PMC5604718/
[5] Baker FC, Driver HS. Temperature regulation in women: effects of the menstrual cycle. Temperature (2020). Full text (PMC): https://pmc.ncbi.nlm.nih.gov/articles/PMC7575238/