
Understanding TrainingPeaks Metrics
TrainingPeaks provides powerful tools for understanding your training load and recovery status. This guide explains what these metrics mean and how to use them effectively—without overcomplicating your training.
The Core Principle: Don't Overcomplicate It
Your training plan is already designed to manage these metrics appropriately. You don't need to obsess over daily values or try to manually manipulate them. These tools are for awareness and context, not for micromanagement.
Watch trends, not daily values. Single-day spikes or drops are normal and expected. What matters is the overall pattern over weeks and months.
Training Stress Score (TSS)
What It Is
TSS quantifies the training load of individual workouts by considering both duration and intensity. It's a single number that represents how hard a workout was.
The formula (simplified):
Based on Intensity Factor (IF) and duration
100 TSS ≈ 1 hour at threshold intensity
Combines how long AND how hard you trained
Examples:
Easy 2-hour ride (65% FTP): ~80 TSS
1-hour threshold workout (95% FTP): ~100 TSS
4-hour endurance ride (70% FTP): ~180 TSS
30-minute VO2max session: ~50 TSS
Why It Matters
TSS allows you to compare workouts of different types:
Long, easy sessions can have similar TSS to short, hard sessions
Helps you understand total training load
Used to calculate fitness and fatigue metrics (CTL and ATL)
What You Should Know
For power-based training:
TSS is calculated automatically from your power file
Accurate representation of physiological stress
For heart rate-based training:
Called hrTSS (heart rate Training Stress Score)
Less precise than power-based TSS
Still useful for tracking trends
For pace-based training (running):
Called rTSS
Based on pace relative to threshold
Don't stress about:
Hitting exact TSS targets daily
Comparing TSS across different sports directly (100 swim TSS ≠ 100 bike TSS in terms of overall fatigue)
Minor variations in weekly totals
Important: Metrics Depend on Accurate Thresholds
All TrainingPeaks metrics (TSS, IF, CTL, ATL, TSB) are calculated based on your FTP or threshold values. If these are wrong, all your metrics will be wrong.
Before worrying about your CTL or TSB:
Verify your FTP/threshold values are current and accurate
See the Platform Setup section for setting thresholds in TrainingPeaks
Retest every 8-12 weeks or when fitness changes significantly
Garbage in = garbage out. Accurate thresholds are the foundation of meaningful metrics. A CTL of 100 based on an inflated FTP doesn't mean the same thing as a CTL of 100 based on an accurate FTP.
Chronic Training Load (CTL)
What It Is
CTL represents your fitness level—the training load you've accumulated over approximately the past 6 weeks (42 days). It's calculated as an exponentially weighted average of your daily TSS.
Think of it as: Your aerobic fitness level or training capacity
The math: Exponentially weighted 42-day average of daily TSS
Recent training weighted more heavily than distant training
Changes slowly (by design)
Builds gradually over weeks and months
How to Interpret CTL
CTL represents your aerobic fitness level or training capacity. The "right" CTL is highly individual and event-specific:
CTL varies dramatically by:
Sport: Swimming inflates CTL significantly compared to cycling or running (90% IF is basic endurance swimming)
Event type: Shorter events typically have lower CTL targets; longer events (Ironman, ultra-cycling) require higher CTL
Training volume: Ultra-endurance athletes routinely train at CTL values that would indicate overtraining for shorter-event athletes
Individual capacity: Two athletes racing the same event may peak at very different CTL values
What matters more than the absolute number:
Trend direction: Is CTL building gradually during training blocks?
Consistency: Stable CTL without wild swings indicates sustainable training
Recovery: Can you absorb the training load and recover between sessions?
Performance: Are you getting faster, or just more fatigued?
Don't compare your CTL to others. An Ironman athlete might appropriately train at CTL 120+, while a criterium racer might peak at CTL 80. Your plan is designed for your specific event and goals.
What CTL Tells You
Rising CTL:
You're building fitness
Training load is increasing
Body is adapting (if recovering properly)
Stable CTL:
Maintenance phase
Consistent training load
Common during race season
Falling CTL:
Reduced training volume
Taper period
Detraining if unintentional
How Fast Should CTL Rise?
General principle: Build CTL gradually over weeks and months. The specific rate varies widely based on your plan, event, and training history.
Typical progression: Most well-designed plans increase CTL by approximately 5-20 TSS per month on average, with significant variation based on:
Training phase (base building vs. peak weeks)
Event distance (longer events = larger CTL increases)
Individual response to training
Your plan manages this progression automatically. Focus on executing workouts rather than hitting specific CTL targets.
Red flags to watch for:
Very rapid CTL spikes (20+ TSS in a single week) without planned progression
Wildly inconsistent training (CTL yo-yos up and down)
Continuing to push hard when recovery indicators are poor
CTL rising while performance and energy are declining
Acute Training Load (ATL)
What It Is
ATL represents your fatigue level—recent training stress that hasn't yet been absorbed and converted to fitness. It's calculated as an exponentially weighted average of your daily TSS over the past week (7 days).
Think of it as: Your current level of fatigue
The math: Exponentially weighted 7-day average of daily TSS
Responds quickly to recent training
Spikes after hard training blocks
Drops quickly with rest
How ATL Relates to Training
High ATL:
You've been training hard recently
Accumulated fatigue
Normal during build weeks
Low ATL:
You've been resting or training easy
Recovered state
Normal during recovery weeks and taper
ATL rising faster than CTL:
Training load increased recently
Building fatigue (potentially overreaching)
Normal in build weeks, watch for recovery signs
ATL dropping while CTL stable:
Recovery week
Taper period
Freshness returning
Training Stress Balance (TSB)
What It Is
TSB is the difference between your fitness (CTL) and fatigue (ATL). It indicates your current freshness level.
The formula: TSB = CTL - ATL
Think of it as: How fresh or fatigued you are relative to your fitness level
Interpreting TSB
Negative TSB (fatigue > fitness):
You're accumulating training stress
Normal and expected during training blocks
Common range: -10 to -30 during hard training weeks
Temporary deep negatives (-40 to -60) are normal with stacked training (e.g., big weekend blocks followed by recovery)
TSB near zero:
Balanced state
Moderate freshness
Typical during race season or moderate training periods
Positive TSB (fitness > fatigue):
Fresh and recovered
Ready for hard efforts or racing
Achieved through taper
Target: +10 to +25 for important races
Using TSB Effectively
The pattern matters more than single values:
During hard training weeks:
Expect negative TSB, sometimes deeply negative
Large stacked training weekends can temporarily push TSB to -40, -50, or lower
This is by design when followed by appropriate recovery
Monitor recovery early in the following week
During recovery weeks:
TSB should rise toward zero or positive
Sign that you're recovering from the training block
Usually happens naturally if you follow your planned recovery
For key races:
Target positive TSB (usually +10 to +25)
Achieved through taper
Too much rest (TSB > +30) can mean loss of sharpness
Red flags - when TSB indicates a problem:
TSB stays deeply negative (-40+) for 2+ weeks without recovery
TSB not recovering during scheduled rest weeks
Feeling terrible despite positive TSB (plan may not fit your current fitness)
Important context: Athletes starting a plan without the assumed fitness base may see prolonged negative TSB values initially. This often resolves as you adapt to the training load, but pay close attention to recovery indicators (sleep, resting heart rate, motivation) and adjust intensity if needed.
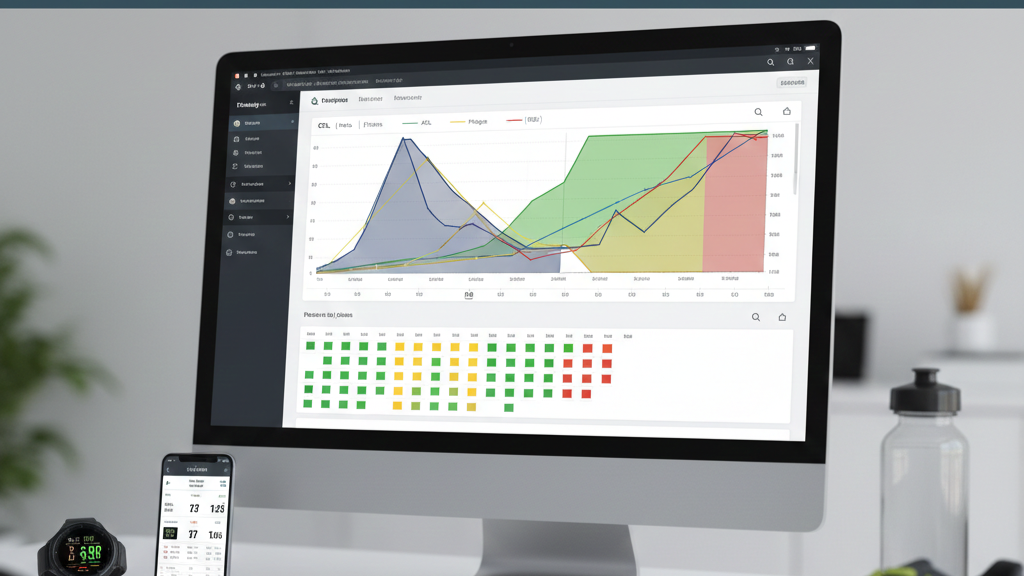
The Performance Management Chart (PMC)
What It Shows
The PMC is a graph that displays CTL, ATL, and TSB over time. It provides visual representation of your fitness, fatigue, and form.
The three lines:
Blue line (CTL): Fitness—should trend gradually upward during training
Pink line (ATL): Fatigue—spikes and drops based on recent training
Yellow bars (TSB): Form—positive when fresh, negative when fatigued
Reading the PMC
Successful training progression:
CTL gradually rising (fitness building)
ATL spiking during hard weeks, dropping during recovery weeks
TSB oscillating negative during training, positive for key events
Warning signs:
CTL declining when it should be building (insufficient training)
CTL rising too fast (injury risk)
ATL consistently very high without recovery (overtraining risk)
TSB deeply negative for weeks without improvement
Common PMC Patterns
Build weeks:
ATL rises above CTL
TSB goes negative
Accumulating productive stress
Recovery weeks:
ATL drops significantly
TSB returns toward zero or positive
Absorbing training adaptations
Taper:
CTL stable or slight decline
ATL drops substantially
TSB rises to positive (freshness for race)
Race season:
CTL relatively stable (maintaining fitness)
ATL and TSB oscillate around race schedule
Small peaks for races
Intensity Factor (IF)
What It Is
IF represents the relative intensity of a workout as a ratio to your FTP (Functional Threshold Power).
The calculation: IF = Normalized Power / FTP
Examples:
Easy endurance ride: IF = 0.55-0.70
Tempo ride: IF = 0.75-0.85
Sweet spot: IF = 0.85-0.95
Threshold: IF = 0.95-1.05
VO2max intervals: IF = 1.05-1.20
Why It Matters
IF helps you understand whether you're hitting target intensities:
Endurance rides should have low IF
Interval sessions should have higher IF
Confirms you're training in intended zones
Don't obsess over exact IF targets. Some variation is normal and expected.
Normalized Power (NP)
What It Is
NP is an estimate of the physiological "cost" of a variable-power workout. It accounts for the fact that variable efforts are harder than steady efforts at the same average power.
Why it exists:
Surges and intervals create more fatigue than steady efforts
Average power doesn't capture this reality
NP attempts to represent actual physiological stress
Example:
Ride A: 200W steady for 1 hour = 200W average, ~200W NP
Ride B: Intervals averaging 200W = 200W average, ~220W NP
Ride B is harder despite same average power
Using NP
For understanding workout difficulty:
NP closer to average power = steady effort
NP significantly higher than average = very variable effort
For calculating TSS and IF:
Both use NP rather than average power
Provides more accurate training load estimate
Don't worry about:
Making NP match average power perfectly
Comparing NP across very different workout types
A Simple Analogy: Your Fitness Bank Account
Think of these metrics like a bank account:
CTL (fitness) = Your account balance. Built up gradually over months of deposits.
TSS (training) = Withdrawals. Each workout costs something.
ATL (fatigue) = Your recent spending. High when you've been withdrawing a lot lately.
TSB (form) = What's left to spend today. Negative = overdraft (fatigued). Positive = surplus (fresh).
Just like finances: You can't spend more than you have indefinitely, but strategic "overdrafts" (negative TSB during training) are part of building wealth (CTL) long-term. The key is managing your spending (training) to build your balance (fitness) without going so far into the red that you can't recover.
Practical Application: Using Metrics Without Obsessing
What to Monitor
Weekly TSS:
Track trends, not exact numbers
Big swings (50%+ increase) deserve attention
Gradual progression is ideal
CTL trends:
Should build gradually during training blocks
Sudden drops indicate missed training
Plateaus during race season are normal
TSB for key events:
Aim for positive TSB (recovered/fresh)
Usually +10 to +25 for important races
Too much rest (TSB > +30) can mean detraining
What NOT to Worry About
Daily TSS fluctuations:
Individual workouts vary—that's normal
Some days higher, some lower
Weekly totals matter more than daily
Exact CTL targets:
No magic number for race-readiness
Highly individual and event-specific
Your plan manages this
Perfect metric alignment:
Metrics are estimates, not gospel
How you feel matters more
Trust subjective assessment over numbers
When Metrics Conflict with How You Feel
If metrics say "recovered" but you feel terrible:
Trust how you feel
Take easier day
Metrics are tools, not commands
If metrics say "fatigued" but you feel great:
Proceed with caution
You can train, but monitor closely
Could indicate early overtraining (feeling good temporarily before crash)
Common Mistakes
Mistake #1: Chasing CTL Numbers
The error: "I need CTL of 100 to race well"
CTL targets are meaningless without context
Individual variation is enormous
Quality of training matters more than CTL
Better approach: Follow your training plan, let CTL be what it will be
Mistake #2: Panicking Over Negative TSB
The error: "My TSB is -25, I must be overtraining!"
Negative TSB during training blocks is normal
It's called "training," not "being fresh all the time"
Recovery weeks will address this
Better approach: Expect negative TSB during hard training, positive during taper
Mistake #3: Micromanaging Daily TSS
The error: "Yesterday was 120 TSS, today must be exactly 115 TSS"
Rigid adherence to daily targets misses the point
Training isn't that precise
Weekly totals and trends matter more
Better approach: Execute the planned workout, don't obsess over resulting TSS
Mistake #4: Ignoring Subjective Feedback
The error: "Metrics say I'm recovered, so I'll do the hard workout even though I feel terrible"
Metrics are estimates
You know your body better than an algorithm
Subjective assessment matters
Better approach: Use metrics to inform decisions, not dictate them
Summary: The Right Way to Use These Metrics
Do:
Monitor weekly trends
Use metrics for awareness and context
Let your training plan manage the progression
Trust how you feel when metrics conflict
Don't:
Obsess over daily fluctuations
Try to manually manipulate metrics
Compare your numbers to other athletes
Override subjective assessment based on metrics
Remember: These tools exist to support your training, not complicate it. Your plan is designed to manage CTL progression, TSB for key events, and appropriate recovery. Trust the structure, use metrics for awareness, and focus on executing quality training.
Additional Resources
TrainingPeaks University:
Important reminder: All of this information is useful for understanding your training, but executing quality workouts and recovering properly will always matter more than perfect metric management.
Key Sources
The metrics and interpretations in this guide are based on:
Training and Racing with a Power Meter (Coggan & Allen) - Original development of TSS, IF, NP, and power-based training concepts
TrainingPeaks University: Understanding TSS - Official documentation on Training Stress Score calculation and application
TrainingPeaks University: CTL, ATL, and TSB - Fitness, fatigue, and form metrics explained
The Performance Manager Chart - How to interpret and use the PMC for training management
These metrics are estimation tools, not absolute measures. Your subjective assessment and how you feel during training remain the most important indicators.